When it comes to PostgreSQL, the pivot table becomes a means of forming a structured data image of which the previous role has become a column. The rich function of these pivot tables is basically to run the summarizing, aggregating, and analyzing operations on the data sets. These steps will constitute the project structure which will help to arrange the data in an easy-to-read format. Here, is an article revolving around creating pivot tables through the crosstab() function. Let us study the subject in detail.
Introduction to Pivot Tables
The pivot table is a graphical representation that makes row data flourish into column one. The data underwent the conversion process to help in the effective transformation of the data by assisting in analyzing them perfectly. This manipulation observes the use of a factor in analytical reporting and the presentation of data with good structure.
Crosstab is the PostgreSQL command used to create pivot tables most often. The table brings along several input rows. It then aggregates them using one or more key columns and finally represents the chosen value of one column to the others. This makes columns out of rows based on required criteria easy.
PostgreSQL crosstab() Function
The crosstab() function in the PostgreSQL dataset has the ‘tablefunc’ module where a set of functions is provided for doing operations like the arrays for tables. This crosstab() function enables the transformation of row data into columns based on specified criteria, similar to pivot tables in Excel.
Creating Pivot Table Using crosstab() Function
Example 1:
In this example, we have provided the ‘sales_table’ that holds the sales for two months. We are using the crosstab function to create a pivot table in PostgreSQL. The data is converted into a column according to the product ID number. Let’s see an implementation to verify the method.
CREATE EXTENSION IF NOT EXISTS tablefunc;
CREATE TABLE sales_table (
    product_id INTEGER,
    month VARCHAR,
    amount DECIMAL
);
INSERT INTO sales_table (product_id, month, amount) VALUES
(1, 'January', 1500),
(1, 'February', 1000),
(2, 'January', 2500),
(2, 'February', 2000);
SELECT * FROM crosstab(
    'SELECT product_id, month, amount FROM sales_table ORDER BY 1,2',
    'SELECT DISTINCT month FROM sales_table ORDER BY 1'
) AS ct (product_id INTEGER, january DECIMAL, february DECIMAL);


Code language: PostgreSQL SQL dialect and PL/pgSQL (pgsql)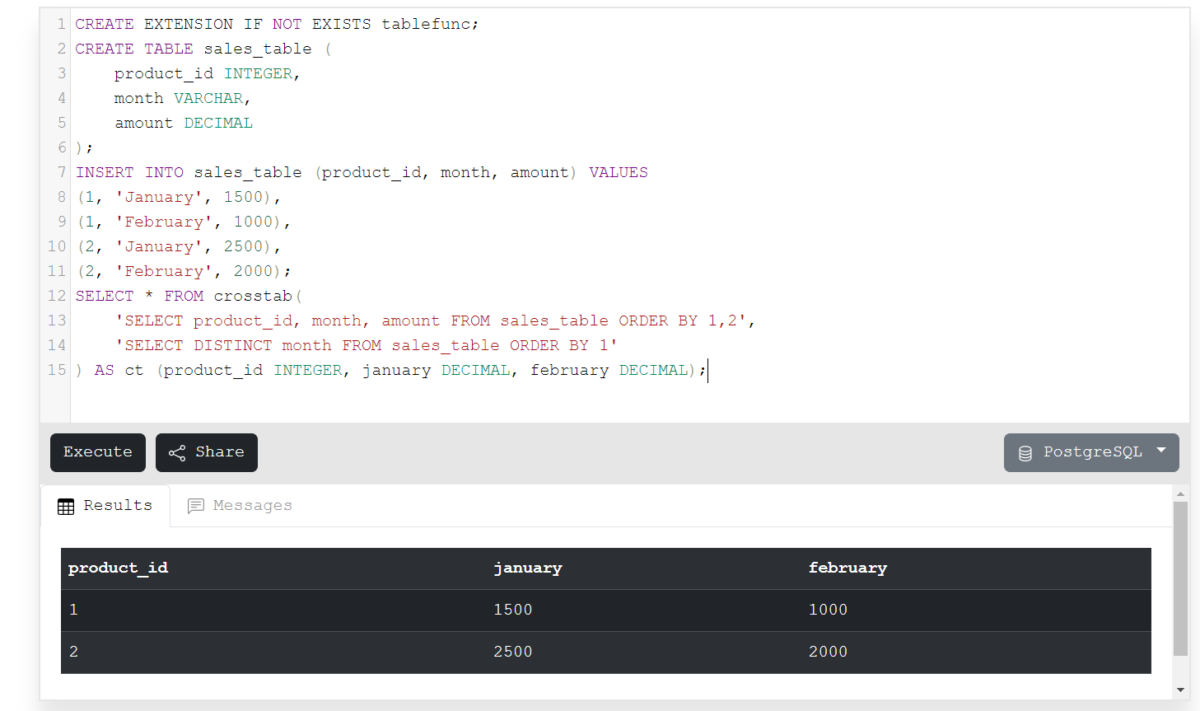
In the outcome, you can see the total amount of each product is categorized as a column inside a table. This conversion helps to get a detailed view of the total amount spent on each product using the product ID number. In this way, you can convert your data into a pivot table using the crosstab function.
Example 2:
Now, let’s try to generate the pivot table using the crosstab function for three different products for three various months. This crosstab function is useful for creating a detailed view of products and their sales for each month. Let’s see the code.
CREATE EXTENSION IF NOT EXISTS tablefunc;
CREATE TABLE sales_table (
    month text,
    product text,
    revenue numeric
);

INSERT INTO sales_table (month, product, revenue) VALUES
('January', 'Product A', 1000),
('January', 'Product B', 1500),
('January', 'Product C', 2000),
('February', 'Product A', 1200),
('February', 'Product B', 1600),
('February', 'Product C', 2100),
('March', 'Product A', 1100),
('March', 'Product B', 1400),
('March', 'Product C', 1900);

SELECT *
FROM crosstab(
   'SELECT month, product, revenue
    FROM sales_table
    ORDER BY 1,2'
) AS ct (month text, "Product A" numeric, "Product B" numeric, "Product C" numeric);
Code language: PostgreSQL SQL dialect and PL/pgSQL (pgsql)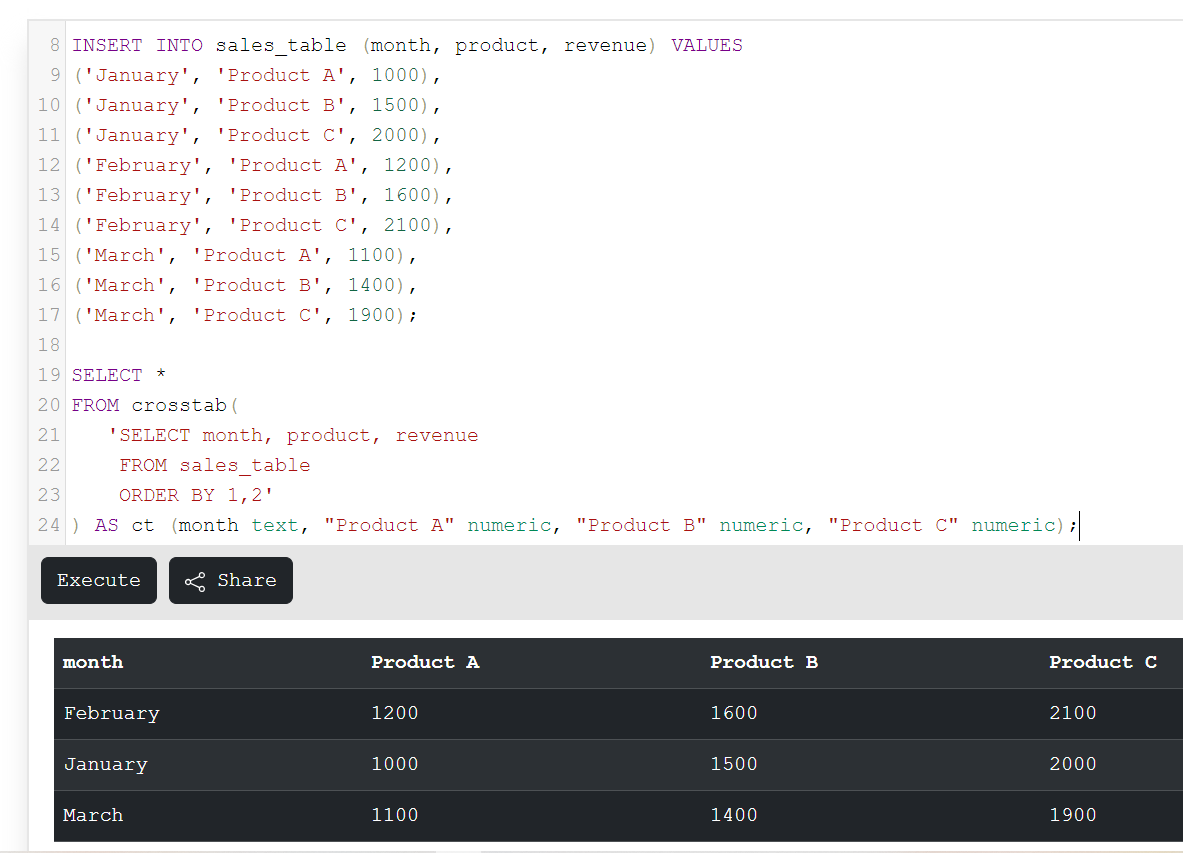
Real-World Applications of Pivot Tables
1. Financial Analysis:
- Pivot tables can summarize sales data by product, region, or period, helping specify trends and top-performing products or regions.
- Pivot tables can manage expense data by category, department, or period, facilitating research of spending patterns and budget tracking.
2. Marketing and Customer Analysis:
- Pivot tables can examine marketing campaign data by channel, audience segment, or campaign type.
- Pivot tables can segment consumers established on demographics, purchase behaviour, or engagement metrics, helping in targeted marketing measures and personalized communication.
3. Supply Chain Management:
- Pivot tables can translate inventory levels by product, location, or supplier, allowing inventory optimization.
- Pivot tables can interpret production data by product line, shift, or machine, facilitating performance monitoring and strategy improvement.
4. Human Resources:
- Pivot tables can rephrase HR data such as employee demographics, turnover rates, or training outcomes, supplying understanding for workforce planning and talent management.
- Pivot tables can examine payroll data by department, position, or pay period, helping provide observation with labour regulations and budget allotment.
Summary
In this article, we have seen the method to convert sample data into a pivot table using the crosstab function in PostgreSQL. The pivot table helps to represent the data in an organized and well-structured format so, we can analyze the outcome properly. The example based on this technique is implemented with results. The real-world applications of pivot tables like financial analysis, customer analysis, supply chain management, and human resources are explained in brief. Hope you will understand the concept and enjoy the article.
Reference
https://stackoverflow.com/questions/69263964/how-to-pivot-in-postgresql