Different models are available in Machine learning, Deep learning, and Data science domain that requires time series databases. The time series database is the values that are plotted against the time. The data values present in such databases are ordered by time. Time series datasets are generally used in business models. Therefore, the analysis of this dataset is important.
In this article, we will study the techniques to analyze time series datasets and some basic information about time series data. Let’s unearth this time series data and it’s an advantage in SQL language. But first, we need to understand what is time series data and where it is used.
What Is Time Series Data and Where It Is Used?
Time series data consists of values attached to time. Models using time series data exist with which predictions can be made. This is vital to the model as it enables them to prepare charts or graphs. A stock market database is the best example as every number corresponds to its respective time in a time series data.
Another one is the number of visitors per day on your site. Hence, various models developed upon these datasets are termed time series models. However, they must be handled with specific data value analysis techniques or methods. Thus, we are solving this complicated matter with the help of SQL queries.
Different Techniques to Analyze Time Series Data
To analyze the time series data SQL language has many functions, JOINs, clauses, and moving averages techniques. Let’s see this technique one by one to understand the process of analysis for time series data.
1. Use of Date and Time Functions
Date and Time functions are fundamental functions in SQL language. The time series data always includes some components like date, time, year, etc. We need these functions to handle the operations related to time series data. In this example, we are using the DATE() function.
SELECT DATE(Date_Column) AS Day, COUNT(*) AS RecordsCount
FROM TimeSeriesTable
GROUP BY DATE(Date_Column);
Code language: SQL (Structured Query Language) (sql)
Output:
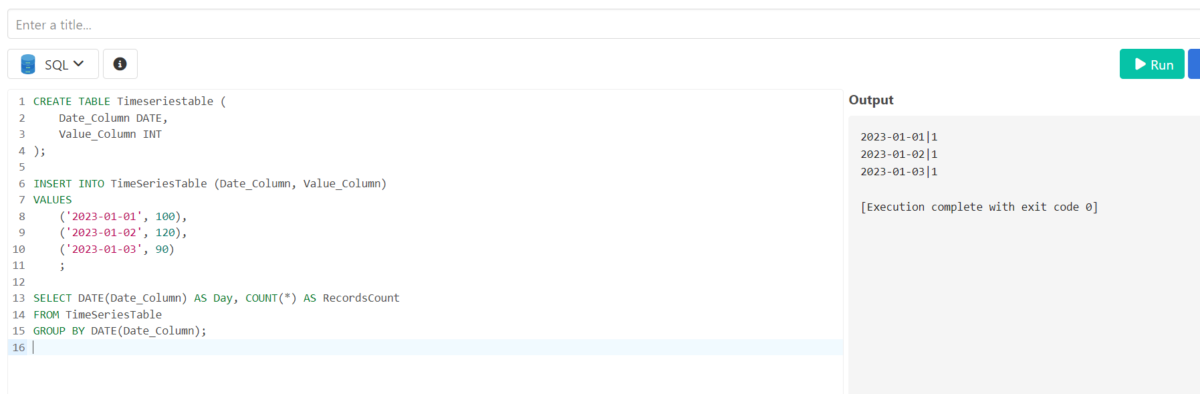
In this example, we are calculating the records of each day using the date and time function on time series data.
2. Moving Average for Time Series Data
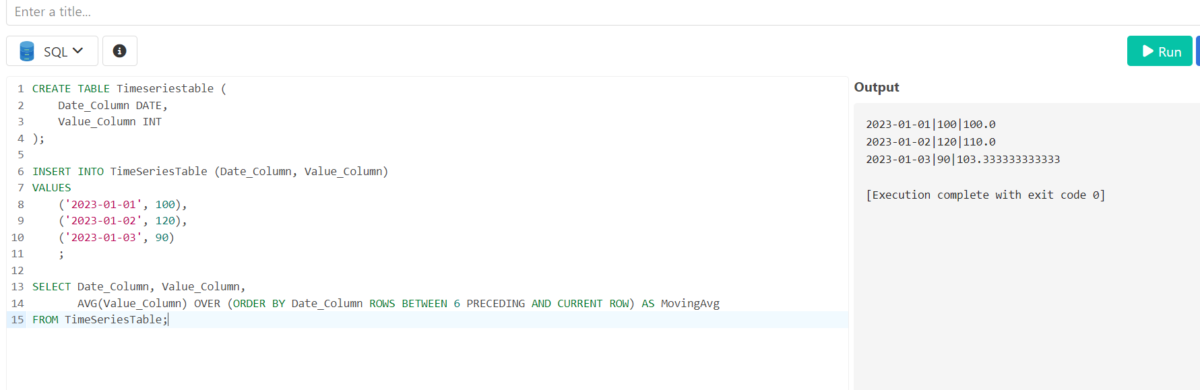
We can also use the moving average technique to analyze the datasets that contain time series data. This technique is mostly used in stock market models. The data from stock market models requires moving averages that help to analyze the patterns, graphs, and trends.
SELECT Date_Column, Value_Column,
       AVG(Value_Column) OVER (ORDER BY Date_Column ROWS BETWEEN 6 PRECEDING AND CURRENT ROW) AS MovingAvg
FROM TimeSeriesTable;Code language: SQL (Structured Query Language) (sql)
We implemented the moving average technique on the same table with the same values. Let’s see the outcome of this method.
Output:
Similarly, you can apply this technique to the stock market dataset and analyze the data.
3. Use of Windows Function-Lag Function for Time Series Data
The Lag function is also used in SQL language to analyze the time series data. The lag function will help to calculate the difference between the values of previous days. This is so simple and optimized technique that is frequently used for comparison in various models.
SELECT Date_Column, Value_Column,
       Value_Column - LAG(Value_Column) OVER (ORDER BY Date_Column) AS DailyChange
FROM TimeSeriesTable;
Code language: SQL (Structured Query Language) (sql)
Output:
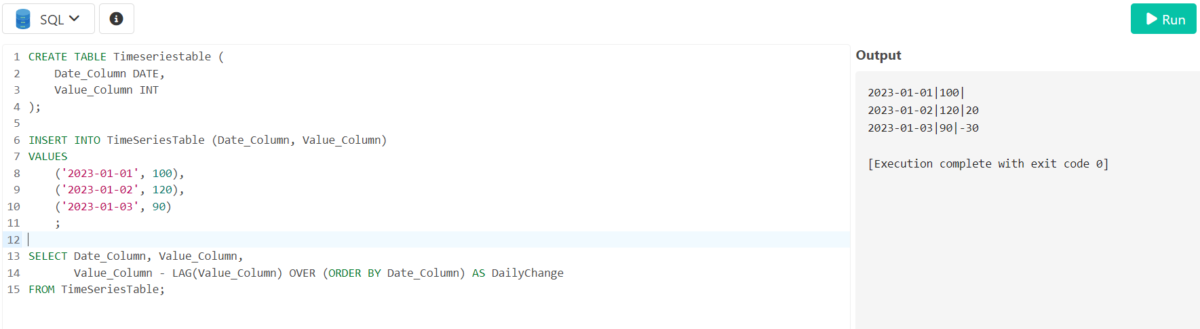
In this example, we have executed the Lag function on the same dataset. The outcome contains the difference in values for the previous day. This is used to plot graphs of comparison in various business models, and stock market datasets, and to compare sales numbers.
4. Decomposition Techniques for Time Series Data
We can decompose the time series data into different components using some techniques and Windows functions. The trends, residuals, and patterns can be obtained using this technique.
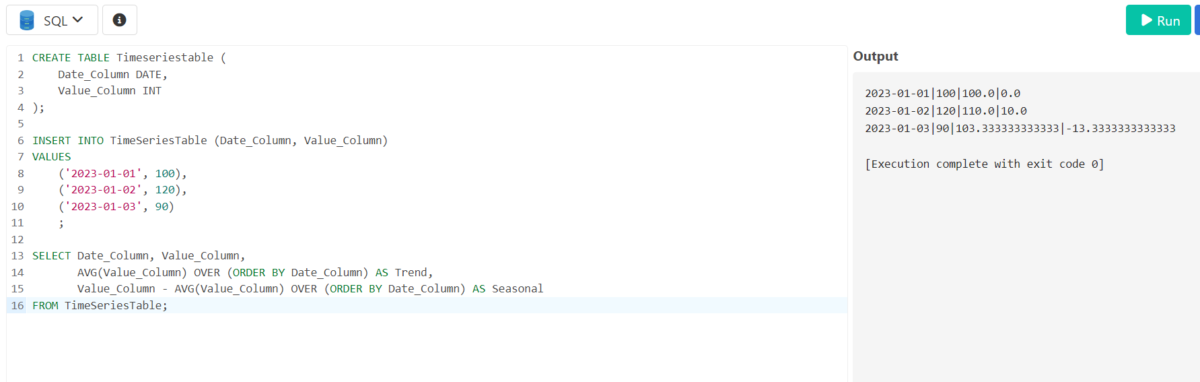
SELECT Date_Column, Value_Column,
       AVG(Value_Column) OVER (ORDER BY Date_Column) AS Trend,
       Value_Column - AVG(Value_Column) OVER (ORDER BY Date_Column) AS Seasonal
FROM TimeSeriesTable;
Code language: SQL (Structured Query Language) (sql)
These values are decomposed using the windows function. The average, trends, etc, are shown in the outcome. You can apply this technique to your dataset to see the outcome.
Output:
These are a few methods/techniques that are used to analyze the time series data in SQL. You can apply this method to your datasets. These methods are really important to know the differences, patterns, trends, etc, in the values.
Why We Need to Analyze Time Series Data in SQL?
- Trend analysis of time series data. Trends understanding determines the right decision-making, forecasting future patterns, and adjustments of strategies.
- With time series analysis, one can trace recurring patterns or seasonality in the data. Such knowledge is necessary for many sectors like retail, climate science research, and even financial forecasting.
- Anomalies and outliers could be detected by using time series analysis. It is useful in the detection of abnormal happenings, possible mistakes and frauds, for example.
- Through time series analysis one can predict future occurrences by examining past patterns. It comes in handy while planning and making decisions and it helps firms and institutions predict likely changes and patterns among people.
Summary
In this article, we have discussed some basic concepts like what is time series data, why we need to analyze this type of value, use cases and a few techniques to analyze them. Various techniques from SQL language are used to analyze the time series data. The functions like window functions, Moving average method, Date and time functions, etc, are used to solve the problem. The patterns, trends, and graphs are formed using the analysis of data values. These techniques are very important because time series datasets and their analysis are used in many complex models for predictions. We hope you will enjoy this article!
Reference
https://stackoverflow.com/questions/74316310/sampling-time-series-data-in-sql